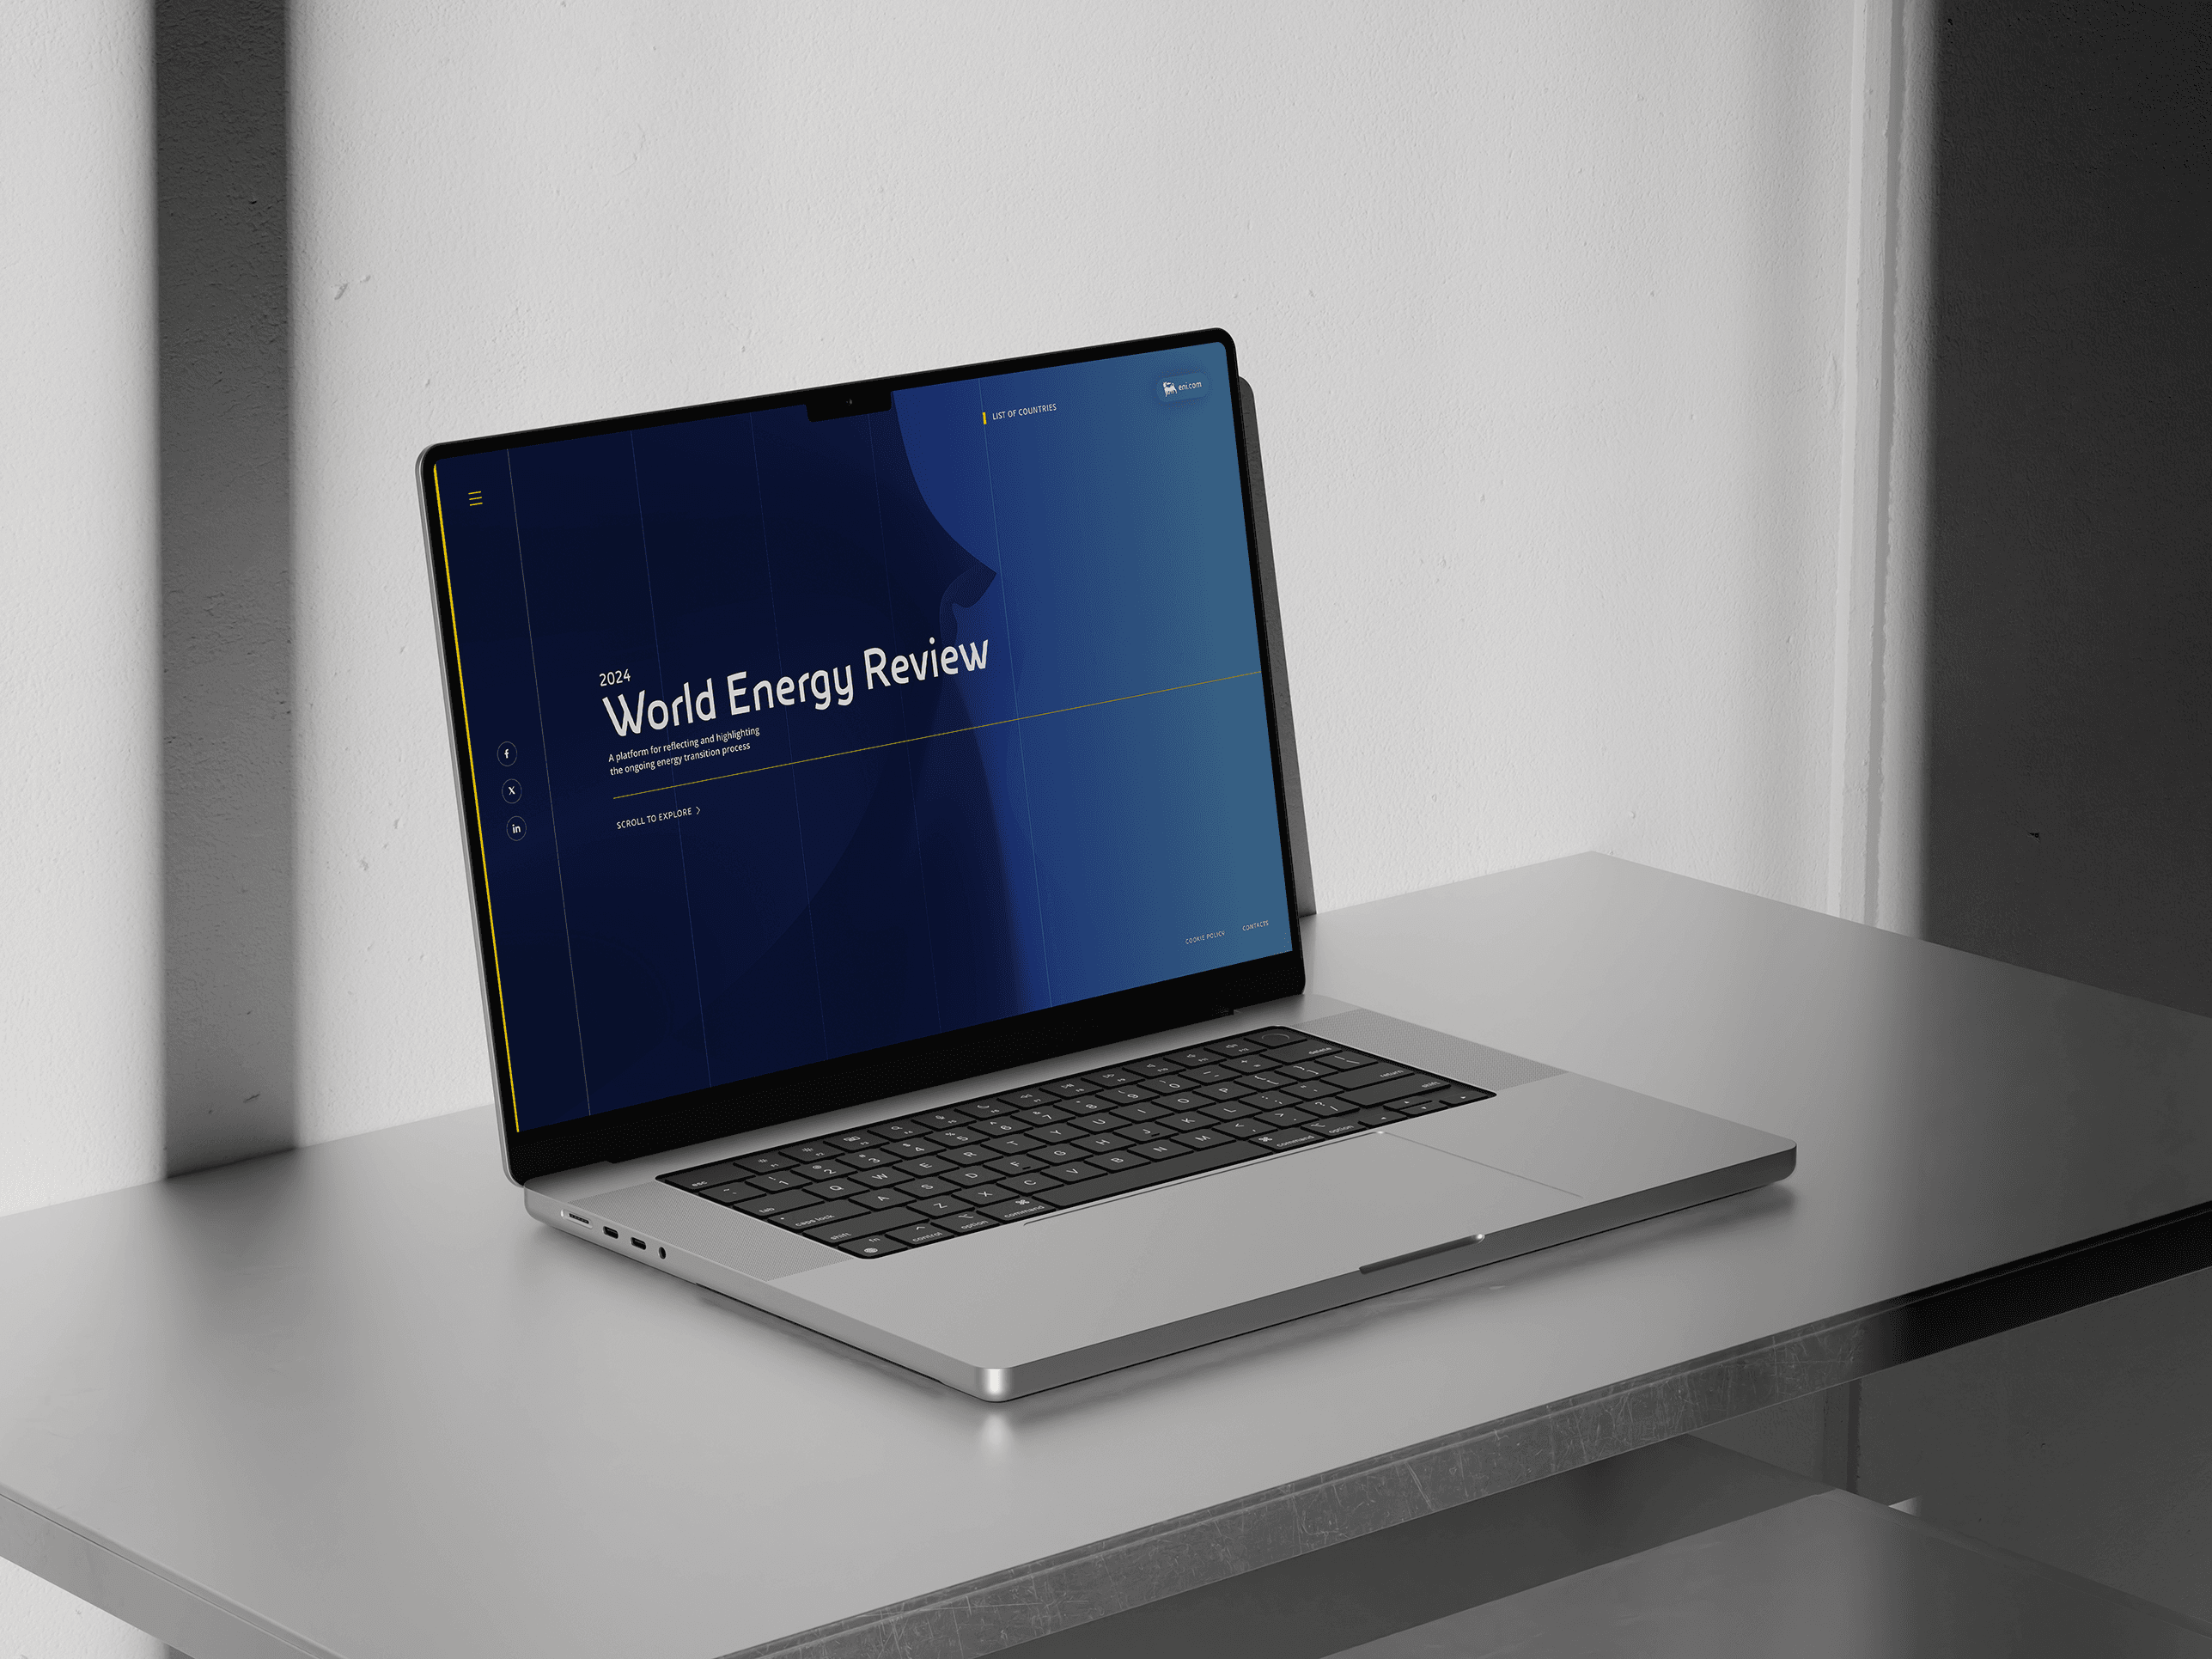
The World Energy Review project is an extensive collaboration with ENI, the largest energy company in Italy and a leading global player. Traditionally used to an institutional report format, ENI wanted to innovate with a data exploration platform accessible even to non-experts, providing valuable insights into the company's activities. The main challenge was to overcome the poor hierarchy of information and the complexity of extracting critical data from the existing reports. With World Energy Review, we transformed ENI's approach to data dissemination, creating a solution that balances professionalism and accessibility, making the data organized, comprehensible, and usable for all users.
Role:
Art Director and UI Designer
Industry:
Energy
Client:
ENI
Key Points
Team size: 4
Departments solicited: UX/UI, Software Engineering, Art Direction, Information Graphics
My role: I was in charge of the Art Direction of the project. I prepared the first versions of the wireframe, following the next steps as a coordinator. I completed the project picking the visual model for the dataset and designing the interactions of the whole website, in close collaboration with the development team.
Softwares: Figma, Miro, Asana
Skills: Wireframing, UX Design, Prototyping, UI Design
Challenges
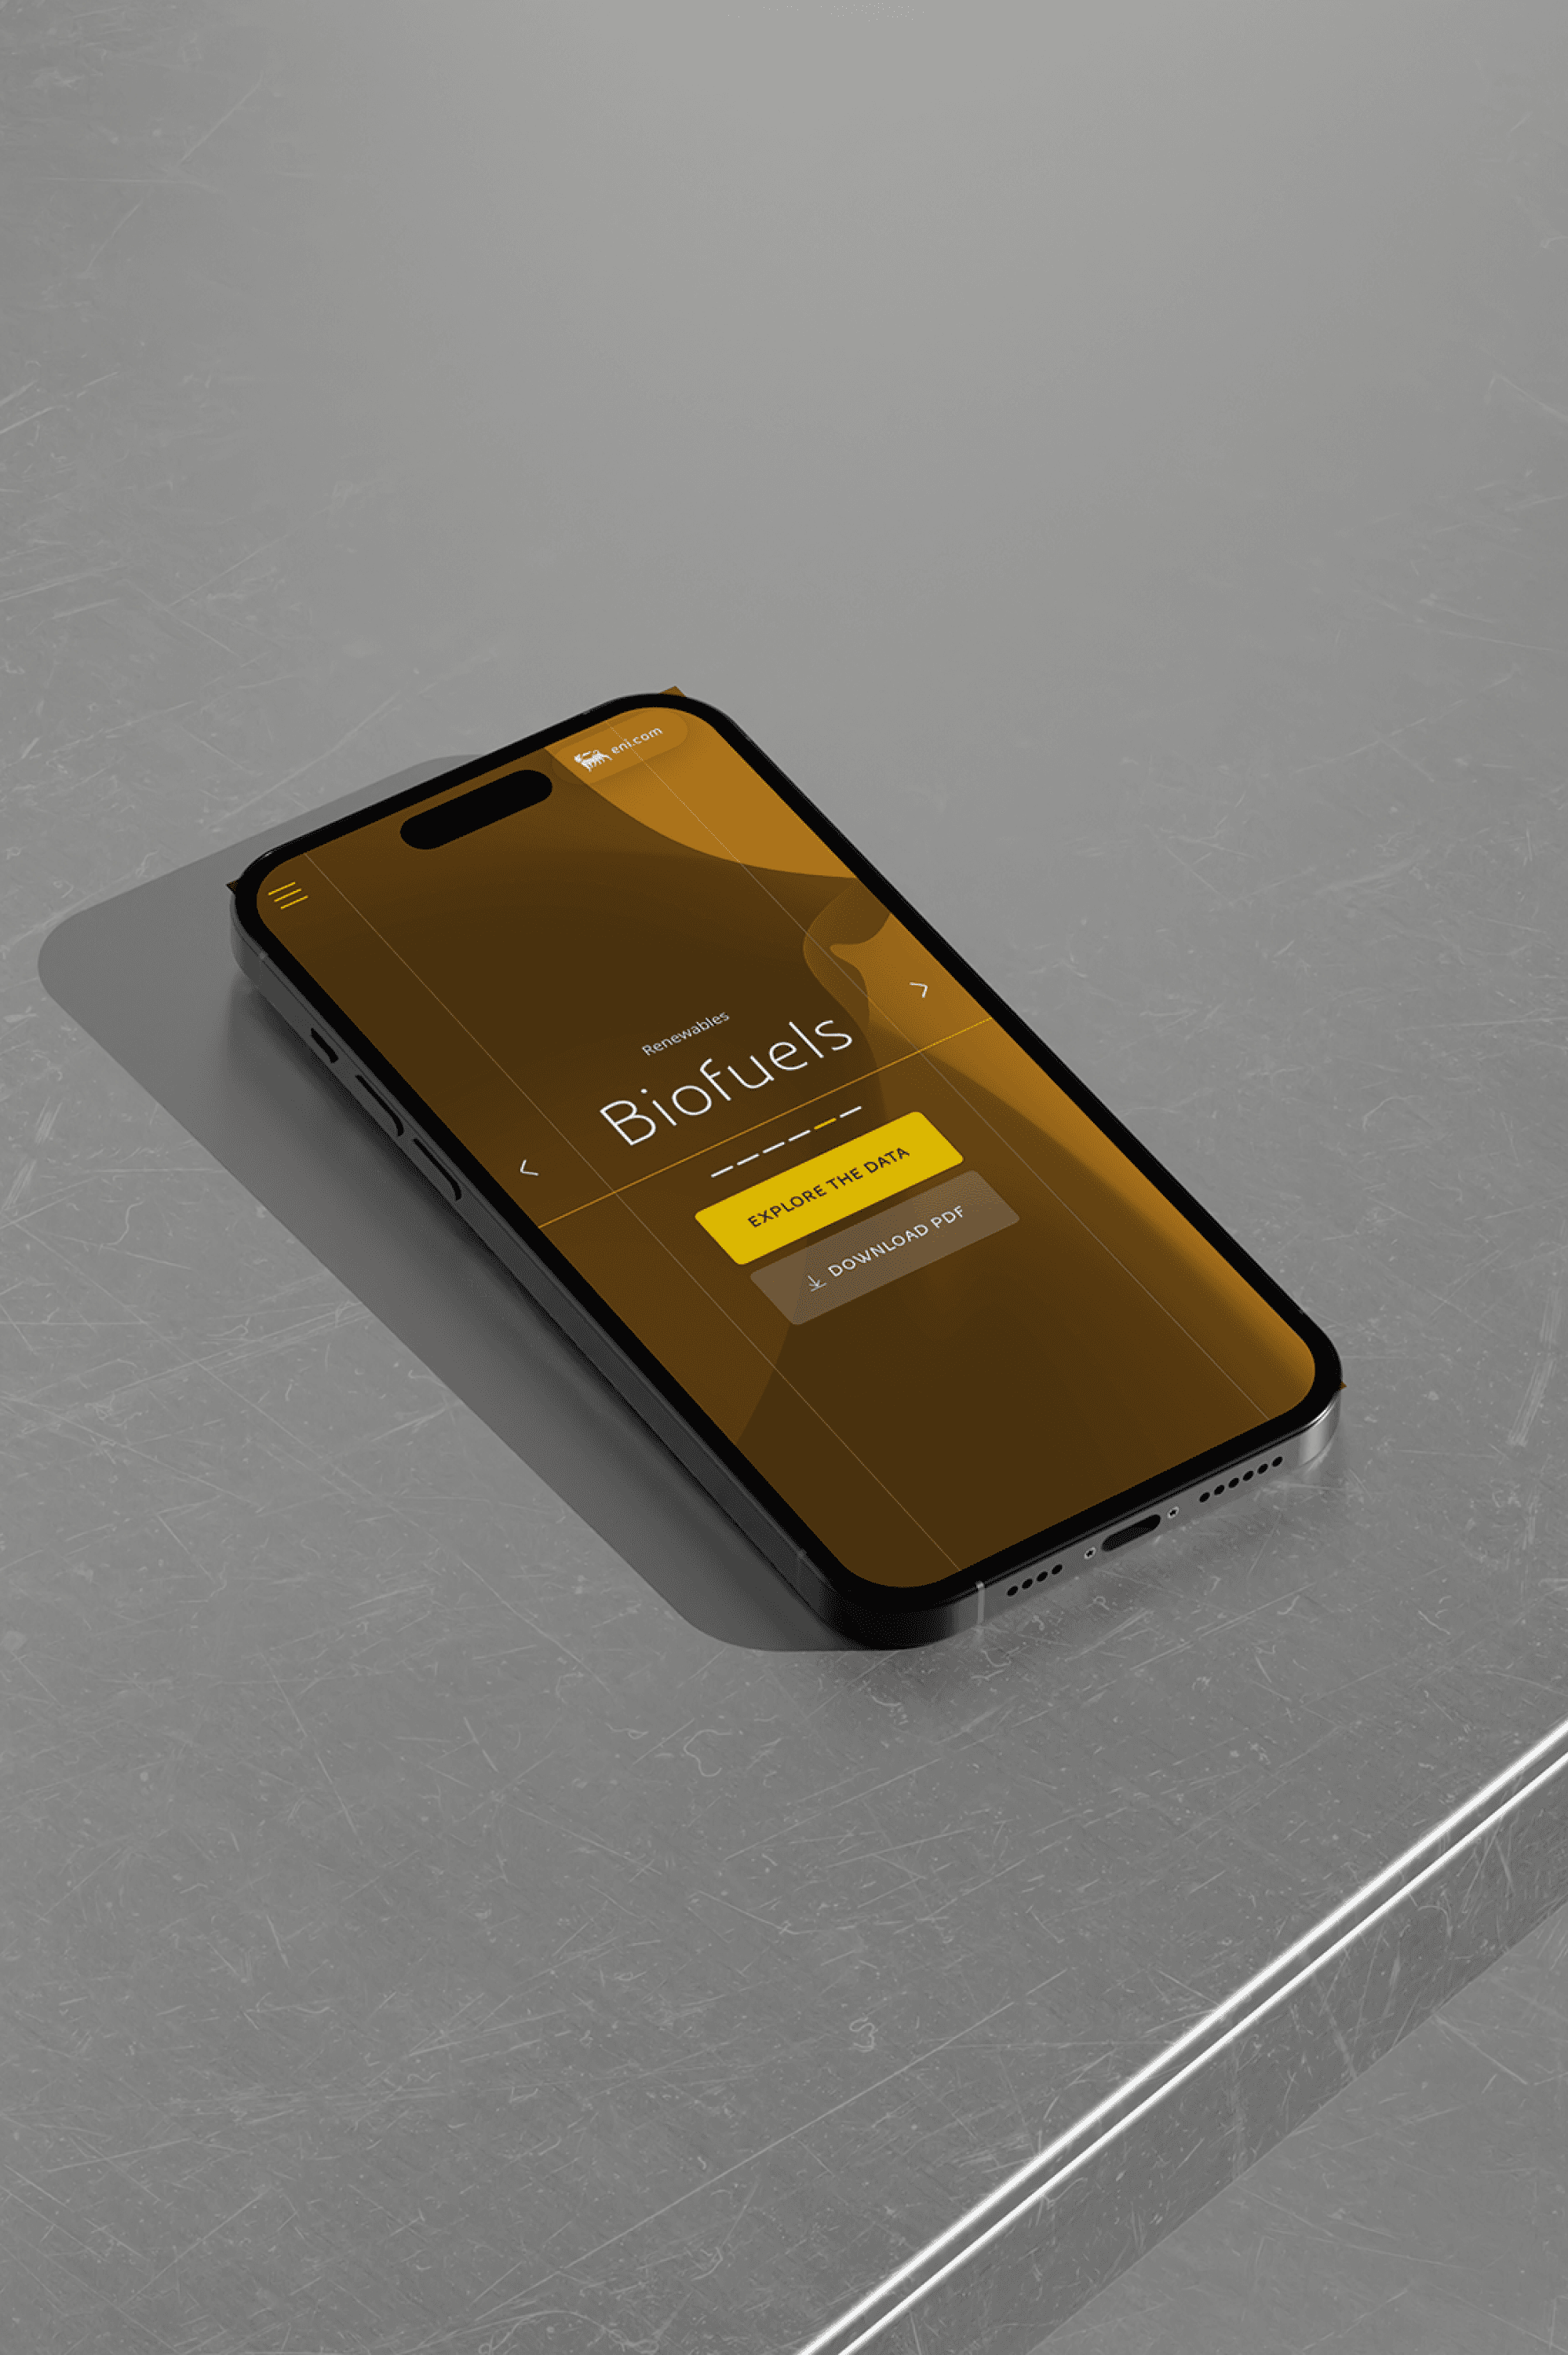
The World Energy Review project faced several challenges, primarily in transforming a traditional institutional report into an engaging data exploration platform. The existing reports lacked a clear hierarchy, making it difficult to extract critical information. Additionally, ensuring that the platform was accessible to non-experts while maintaining a professional tone presented a design challenge. The integration of distinct color palettes for different sections aimed to enhance navigation and user experience, requiring careful consideration to ensure a harmonious aesthetic throughout the platform.
Approach
Data Analysis and Client Collaboration
The first step was conducting a review of existing documents and reports to understand the information hierarchy. Then was fundamental the engagement in meetings with ENI stakeholders to gather insights and clarify their objectives for the platform.
User Testing and Feedback
In the preliminary phase, we performed internal user testing to identify usability issues and ensure that the data was organized effectively for various user levels.Design Development in Figma
In the end all the insights and feedback were translated into a structured design system using Figma, focusing on clear navigation and a cohesive visual language that enhances data clarity and user engagement
This democratization of data not only fosters public interest but also encourages informed discussions around energy practices, reinforcing ENI's commitment to openness and accountability in an industry often viewed with skepticism.