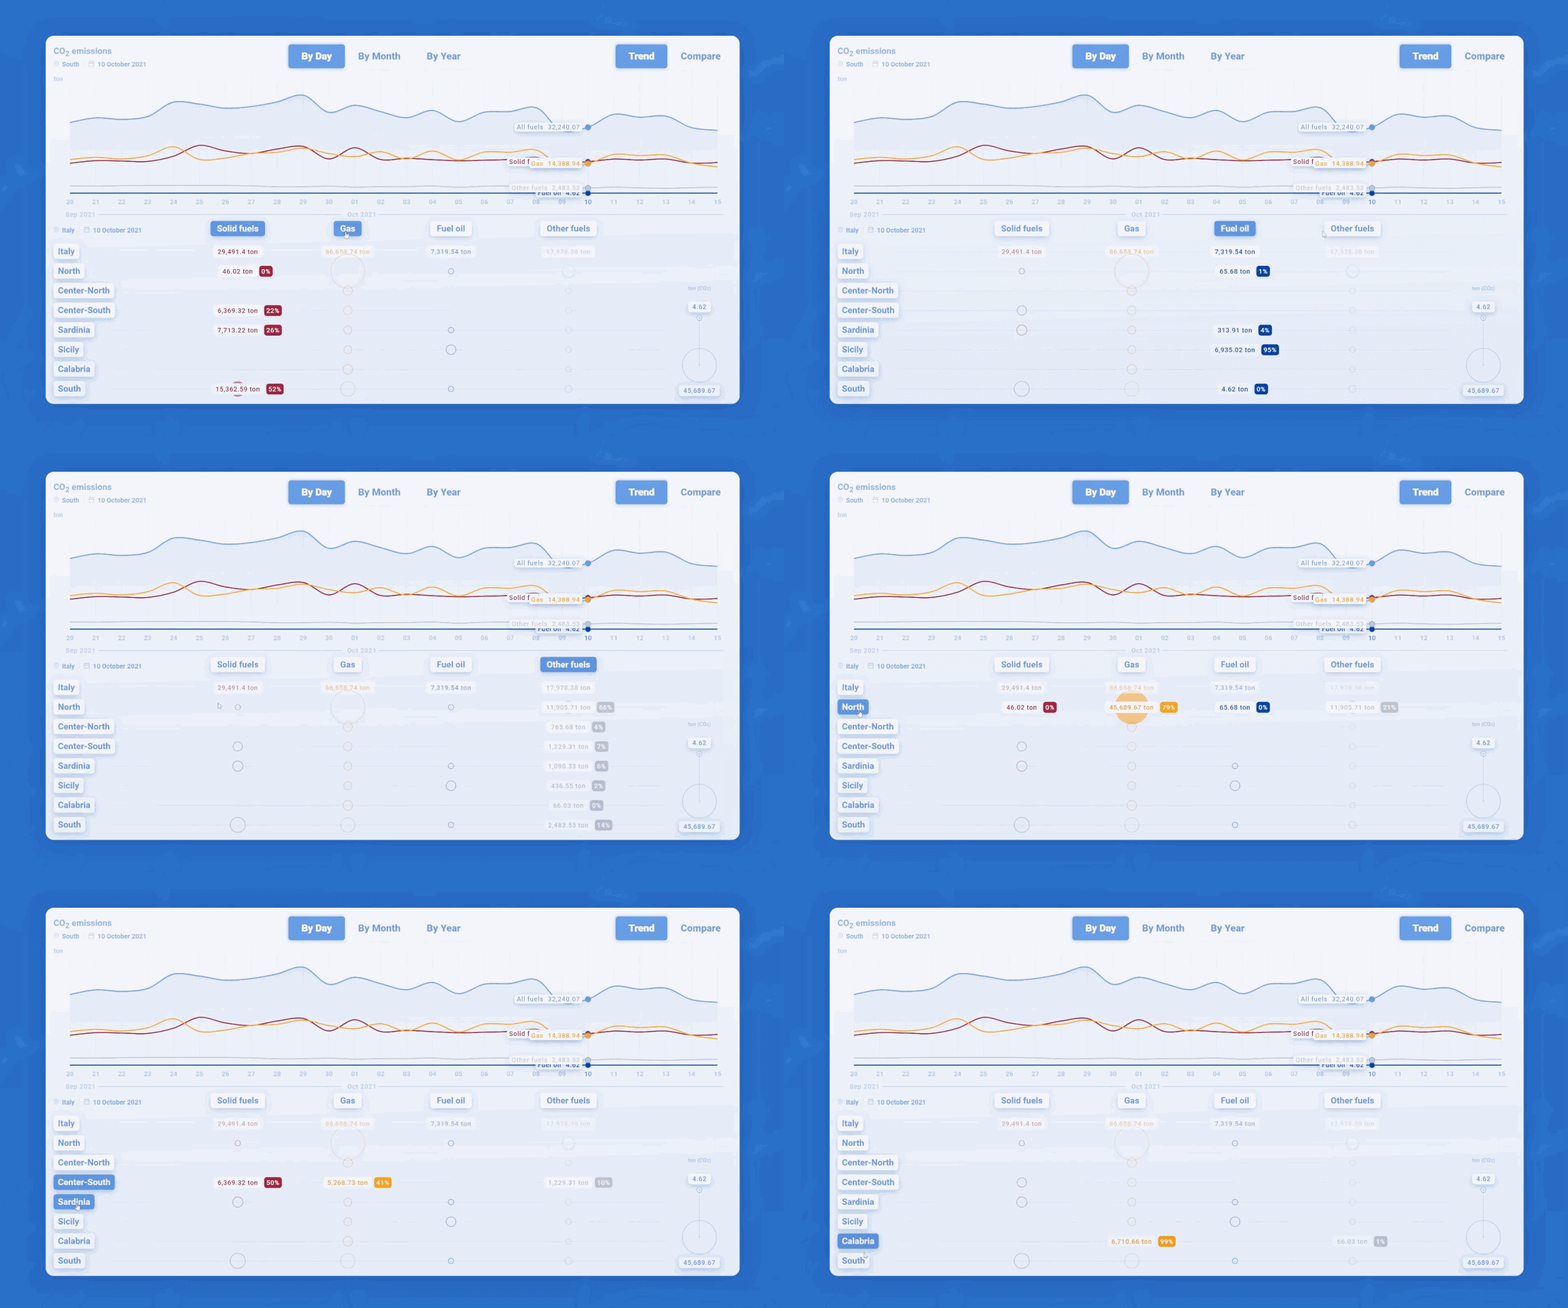
Terna4Green is an interactive dashboard to monitor Italy’s energy transition, providing real-time data on CO₂ savings and emissions from renewable and thermoelectric sources. It offers public access to environmental data, enabling analysis based on weather variables and market zones, and includes historical comparisons. The platform enhances Terna’s leadership in decarbonization and sustainable energy.
Role:
Data Visualization Designer
Industry:
Energy
Client:
Terna
Key Points
Team size: 4
Departments solicited: Web Developing, UX/UI, Data Science, Art Direction
My role: As the Data Visualization Designer for the Terna 4 Green platform, I contributed to transforming complex energy transition data into clear, interactive visual narratives. My role focused on designing intuitive dashboards and visual elements that effectively communicated real-time energy metrics, ensuring accessibility for both industry professionals and the broader public. I collaborated with developers and analysts to integrate dynamic data streams, balancing technical precision with engaging, user-friendly design.
Skills: Data Visualization, Dashboard Design, Storytelling, Art Direction, Graphics
Challenges
The project faced challenges in integrating vast amounts of real-time energy data from multiple sources into a single, user-friendly platform. Ensuring data accuracy, maintaining up-to-date information, and presenting complex energy transition metrics in an intuitive and accessible way were key hurdles. Balancing technical detail with visual clarity required careful design decisions, making the platform both informative for experts and approachable for the public.
Approach
1. Data analysis and insights
I begin by analyzing raw data to extract key insights that guide the design process. By identifying relevant trends, I ensure the visualizations communicate valuable information in a clear, engaging way for users.
2. Visualization creation and validation
We develop and refine interactive prototypes based on the insights gathered. Through client collaboration and user testing, we validate the visualizations to ensure they meet user needs and expectations.
3. Deployment and monitoring
After deployment, we conduct thorough debugging and monitor performance. We also implement additional features (e.g., weather integration) to enhance the user experience and ensure long-term usability.


