Wikipedia is a major source of information, featuring graphics and data visualizations from various origins and including government sources and user contributions. However, the current UI often limits these visualizations to small thumbnails, making them hard to read. The research proposes an open toolkit designed to create effective data visualizations for small spaces like thumbnails.
Role:
UX Researcher and Art Director
Industry:
-
Client:
-
Key Points
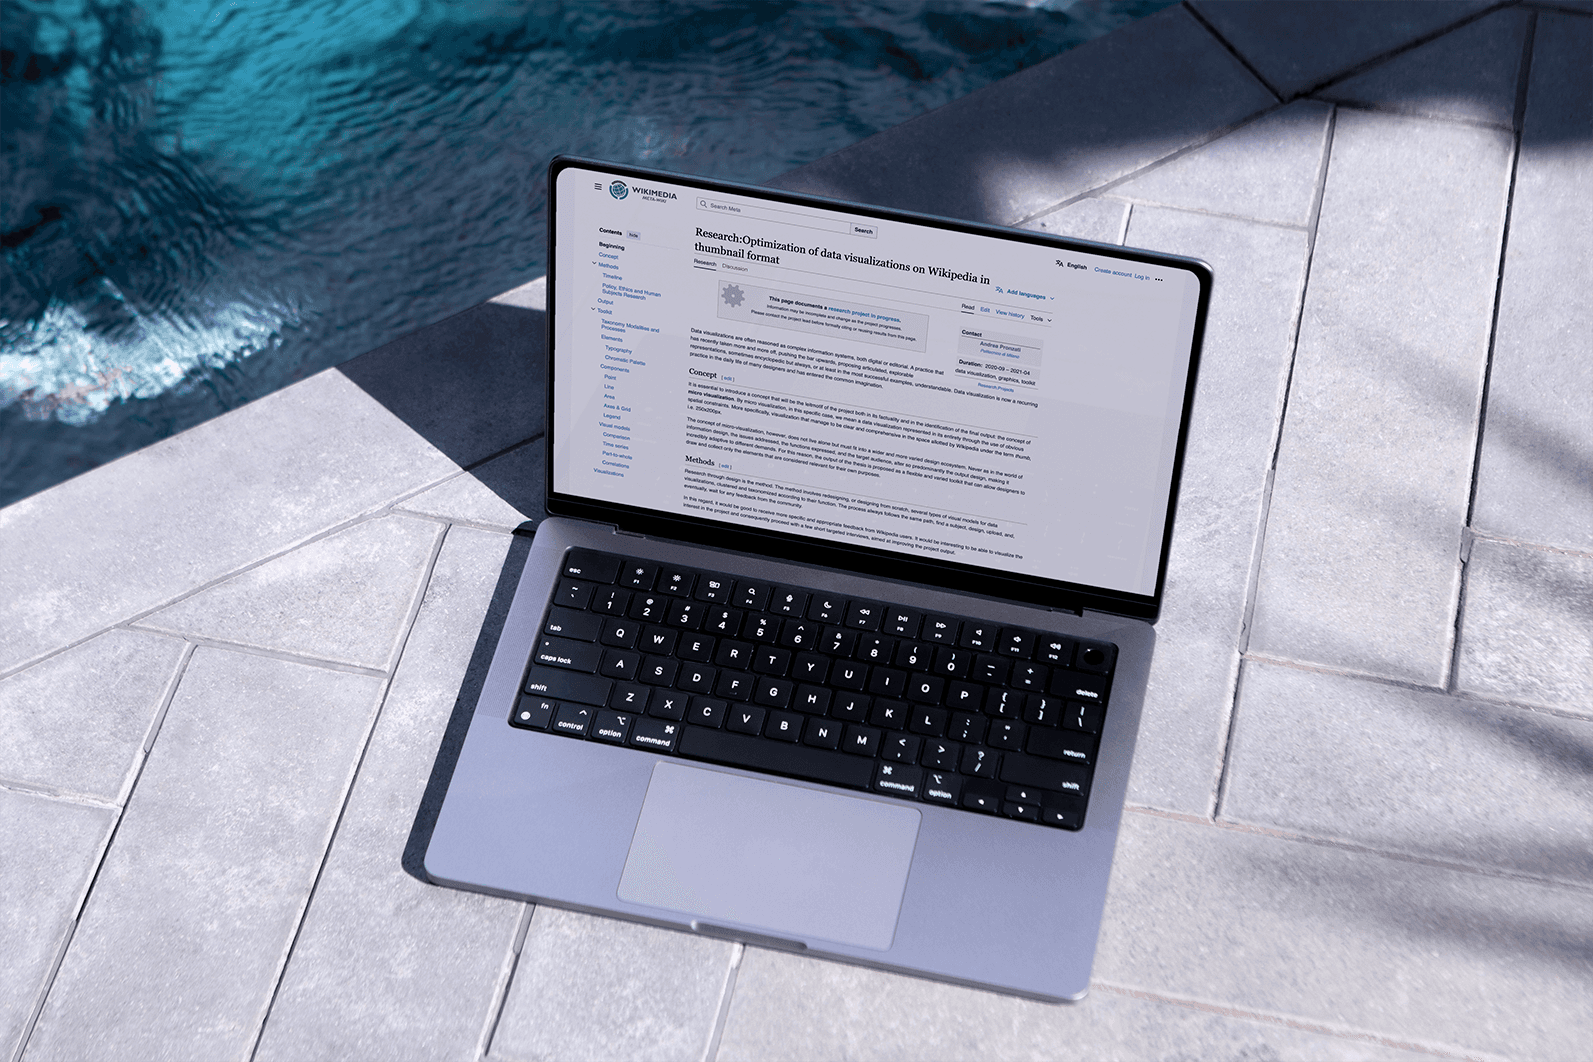
As of now, the toolkit is published on the Wikimedia project at the following link: Optimization of data visualizations on Wikipedia in thumbnail format. The toolkit remains active and is regularly accessed and consulted by a diverse range of users. All the proposed visualizations have been retained on the platform, some even receiving positive feedback from the community. This ongoing engagement demonstrates the effectiveness and relevance of the toolkit within the broader context of online data visualization.
Challenges
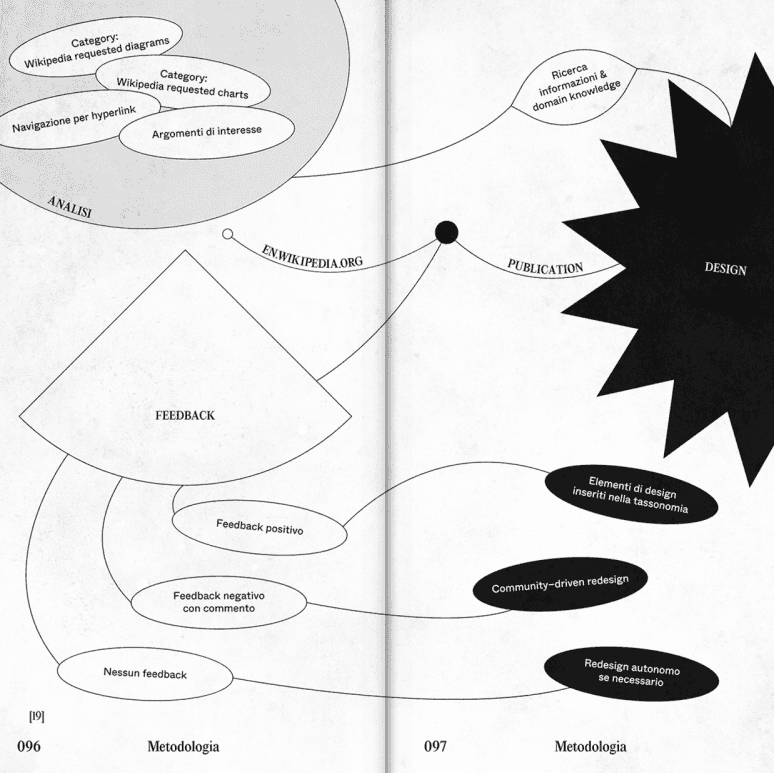
The main challenge was to work on an open source platform, where, through discussion with users, it was possible to edit, rework and improve the toolkit and the proposed visualizations. The toolkit itself was developed following a precise Design Through Research methodology, which allowed the final product to be increasingly refined.
Through personal work experience in communication studies with a strong focus on infographics, it was possible to create a shared and revised toolkit that served various online users and was published as a scientific paper on DIIID.
Approach
Preliminary Phase
The project began with extensive research on successful small-scale visualizations, particularly from sources like the New York Times. I gathered and categorized examples, identifying common design elements that made these visualizations effective in conveying information concisely.
Wikipedia research and Toolkit
From there, I distilled these findings into a set of principles and applied them to create twenty new visualizations, which I then integrated into Wikipedia, enhancing the platform's data presentation.As a next step, I developed a comprehensive toolkit of best practices aimed at guiding others in creating similarly impactful visualizations on digital platforms. This toolkit offers practical advice for crafting clear and effective infographics in tight spaces, making it especially valuable for the online community. The project was fully independent, allowing me to explore my own graphic style and experiment with editorial and typographic elements, ultimately producing a refined research book on micro visualizations.